Crime Map for West Midlands
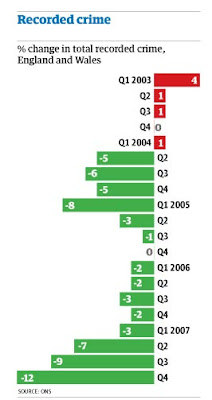
In the Guardian article, Recorded crime falls by 12%, the Home Office figure for the fall in crime is 12% with Police in England and Wales reporting falls in robbery of 21%, criminal damage down 17% and violence against the person down 10%. This is supported by the British Crime Survey (BCS) which puts the fall in crime at 6% during 2007 with violent crime falling at 6% also.

http://www.guardian.co.uk/uk/2008/apr/24/ukcrime.police?gusrc=rss&feed=networkfront
West Midlands Police helpfully has created a website called MyNeighbourhood which allows you to view the latest crime in your neighbourhood and to allow you to have your say through a short interactive website poll.
Here is the crime for my neighbourhood for the past 12 months.
Changing the map you can reveal the change in crime for those 12 months and by clicking View Trends you can see a bar chart graph of crimes recorded month by month which reveals for my neighbourhood the most crimes in 2007 were in September with 96 reported.

If you return to the map, in this example the city centre, you can further differentiate by type of crime by clicking on Change/View Crime Types. This can be used as in the example below to show Robbery or Wounding, Criminal Damage, Theft from Motor Vehicle etc.


Comments